Reading an HPLC chromatogram without a chemistry degree
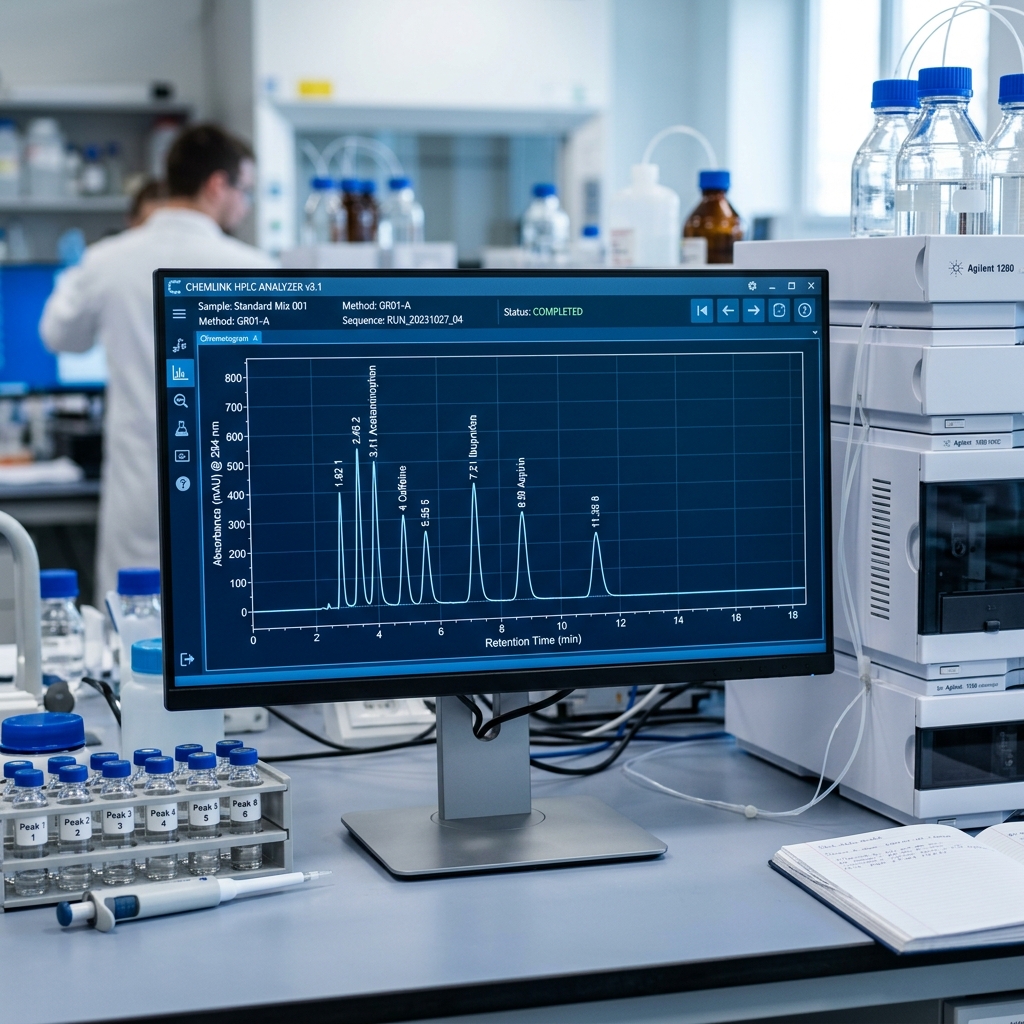
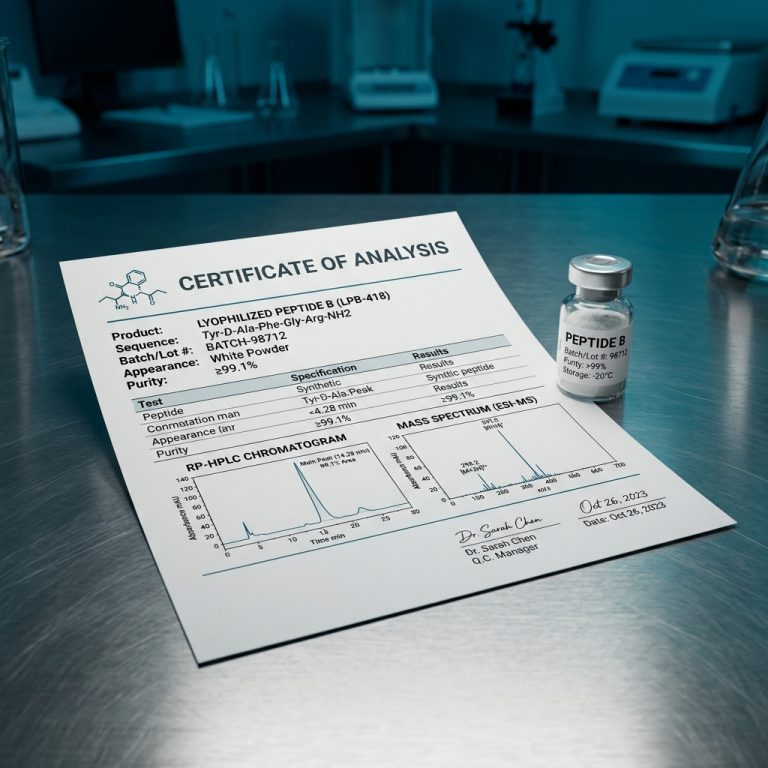
The chromatogram attached to a Certificate of Analysis looks intimidating and is mostly not. It is a plot of detector response against time, and four things on it carry nearly all the information.
Retention time
The x-axis is time. A compound moves through the column at a rate determined by how strongly it interacts with the stationary phase, so it emerges — elutes — at a characteristic time under a fixed method. That time is the compound’s fingerprint for that method. Retention times are not transferable between different columns or gradients, which is why the method conditions are printed alongside the trace.
Peak area
The y-axis is detector response. The area under a peak is proportional to how much of that species passed the detector. Purity by HPLC is reported as area percent: the target peak’s area divided by the total area of all peaks, times 100.
The proportionality constant differs between compounds, so area percent is a good measure of relative composition and an imperfect measure of absolute mass. For lot-to-lot comparison of the same compound it is exactly the right tool.
Baseline
A flat, low baseline means the detector is seeing nothing but mobile phase between peaks. A drifting or noisy baseline can indicate column contamination, temperature instability, or a detector problem — and it makes integration less reliable, which propagates into the reported purity figure.
Peak shape
A clean peak is narrow and symmetric. Two shapes are worth a follow-up question:
- Tailing — the peak trails off to the right. Often secondary interactions with the stationary phase; can also indicate column degradation.
- Shouldering or splitting — a bump on the flank of the main peak, or a peak with two apexes. This can mean a closely-related impurity is co-eluting, and it is the one shape that most directly threatens the reported purity number.
What to look at first
In practice: confirm the main peak is where the method says it should be, check it is symmetric and well separated from its neighbours, look at what fraction of total area sits in the other peaks, and confirm the baseline is quiet. That is a thirty-second read that will tell you whether the headline purity figure deserves your confidence.